Sustainability Management Promotion System
To achieve sustainability management, the Morinaga Milk Group is engaged in corporate activities and on-site activities with the objective of ensuring both the resolution of social issues and the improvement of profitability based on the approach that it is crucial that each and every employee makes sustainability initiatives a matter of personal responsibility.
In addressing issues from medium- to long-term perspective, we are promoting corporate activities and on-site activities viewing them as the two wheels of an axis, aiming at an early realization of sustainability management. In the aspect of corporate activities, we are promoting he Sustainability Medium- to Long-Term Plan 2030, which sets the FY 2030 as the target year to achieve common objectives of the Group. In the aspect of on-site activities, we are encouraging employees to make sustainability their own personal responsibility through sustainability activities at business sites that applies to workplaces at all sites of the Group.

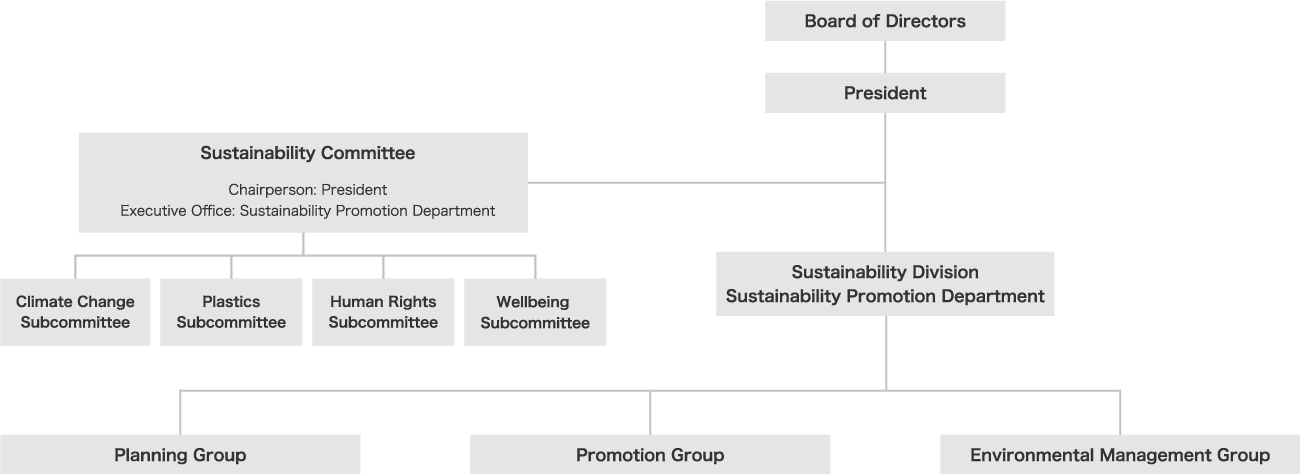
Sustainability Committee and Sustainability Promotion Conference
From fiscal year 2025, in order to strengthen the sustainability and governance system, the former Sustainability Committee has been divided into a Sustainability Committee, led by management to discuss mid- to long-term directions, and a Sustainability Promotion Conference, led by executives to plan, formulate, and promote concrete implementation measures.Additionally, to further promote sustainability activities, a new Dairy Farm Services Department Subcommittee was established, and we will continue to discuss GHG reduction and sustainable dairy farming.
The Sustainability Committee consists of the lead external director as chairperson, several internal officers, including the president, and external officers as members, and also includes external experts. The contents of the discussions are referred to and reported on between the Board of Directors.The Sustainability Promotion Conference is chaired by the president, with all division heads participating and discussions held with departments responsible for implementing the measures; the content of the discussions is reported to the Board of Directors.The secretariat for both the Committee and Promotion Conference is provided by the Sustainability Promotion Department.

Matters to be discussed and content of discussions
Sustainability Committee
Matters to be discussed
- Formulation of long-term sustainability strategies, establishment of a management system for achieving ESG goals
- Ideals for realizing our Corporate Philosophy and 10-Year Vision
- Response to sustainability-related environmental and social issues surrounding the Company
- Value creation in sustainability management
- Clarification of the purpose of sustainability management and setting appropriate KPIs
- Confirmation of progress for each Priority Issue
- Content and methods of ESG communication with stakeholders
Content of recent discussions
First discussion in FY 2025 (May 2025)
- Wellbeing that should be addressed by companies (presentation by an outside expert)
- ESG third party evaluation
- Sustainability Mid- to Long-term Plan 2030 FY2024 Progress Report (Progress check of main KPIs: CO₂ emissions, water usage, etc.)
- Sustainability information disclosure
- Measures to address climate change (Scope 1, 2, 3; water risks; etc.)
- Plastic measures
- Human rights issues
- Wellbeing
- Sustainability activities at business sites
Sustainability Promotion Conference
Matters to be discussed
- Solving each Priority Issue, achieving KPIs
- Progress reports from each subcommittee and discussions for problem-solving
- Monitoring and reporting of the effectiveness of policies
- Construction and development of an in-house promotion system for sustainability management
- Prevention of ESG washing
Content of recent discussions
First discussion in FY 2025 (August 2025)
- Sustainability trends
- ESG third party evaluation
- Sustainability Mid- to Long-term Plan 2030 FY2024 Progress Report (Progress check of main KPIs: CO₂ emissions, water usage, etc.)
- Measures to address climate change (Scope 1, 2, 3; water risks; etc.)
- Dairy Farm Services Department Subcommittee
- Initiatives for plastics
Sustainability activities at business sites
The Group is focusing efforts on sustainability activities at business sites with the aim of making sustainability the personal responsibility of all employees through coexistence with local communities as well as communication and contribution with stakeholders.
Sustainability Promotion Leaders Program
Since 2021, in order to promote sustainability activities at business sites, we have appointed Sustainability Promotion Leaders at 82 domestic Group business sites.
Under the supervision of heads of sites responsible for promoting activities, these Promotion Leaders set and implement various topics related to sustainability activities at their own business sites.
In June 2024, as part of these efforts, we held a nationwide carton collection campaign and donated recycled paper products according to the number of cartons collected.
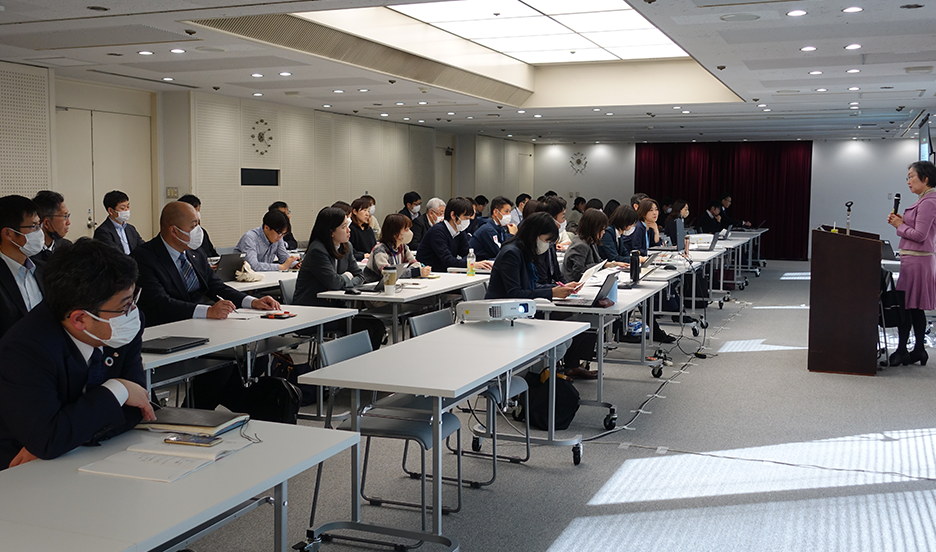
At the Sustainability Forum held twice a year, we share knowledge of activities from each business site.
Sustainability Forum
The Sustainability Forum is held twice a year to provide the opportunity for Promotion Leaders around Japan to get together and impart their knowledge on promoting activities with one another for the benefit of all.

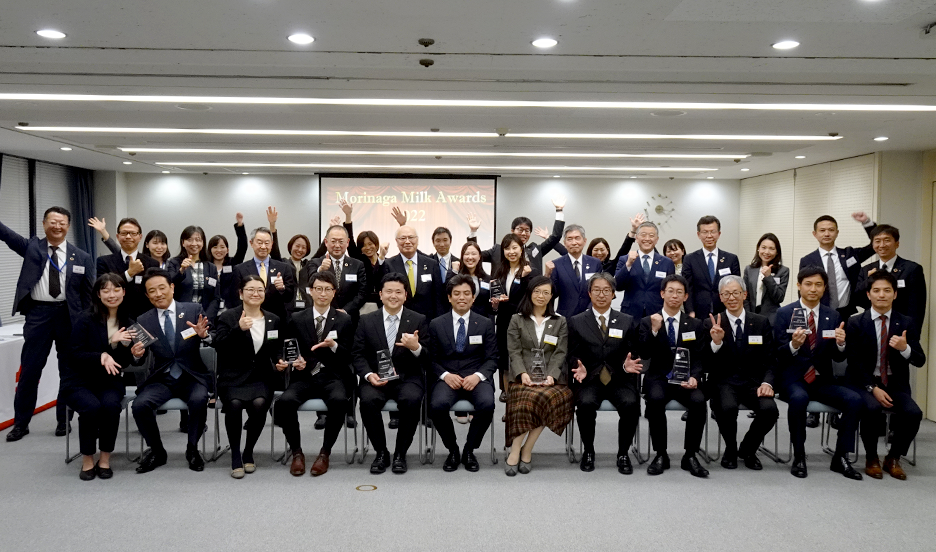
Hosting of the Morinaga Milk Awards (MMA)
MMA, our in-house award system held once a year, features the Food & Well-being Grand Prize, Resources & Environment Grand Prize, and People & Society Grand Prize. MMA is a system that recognizes outstanding initiatives in line with three themes from sustainability activities at our business sites across Japan. By commending the activities of each business site company-wide and broadly sharing best practices internally, we aim to foster a culture where employees continue to take on challenges, boost employee motivation, and energize workplaces.

Sustainability education for employees
To ensure that everyone at the Morinaga Milk Group makes sustainability their own personal responsibility, educational courses are provided at all Group companies to help foster understanding of sustainability, SDGs and the Sustainability Medium- to Long-Term Plan 2030.
For all Group employees, we regularly offer video content and e-learning programs, as well as seminars to learn about sustainability initiatives at other companies. In FY 2024, 99.4% of all Group employees took e-learning courses.
Participatory workshops for employees and study sessions are also held at business sites in Japan to help foster understanding of Sustainability Medium- to Long-Term Plan 2030. In addition, in FY 2024, we visited 15 domestic business sites in-person to provide explanations about the Sustainability Medium- to Long-Term Plan 2030, and exchanged opinions.
Sustainability Promotion Department
The committee is composed of the Planning Group, the Promotion Group, and the Environmental Management Group. The responsibilities of each group are as follows.
Planning Group
Planning and drafting of the Medium- to Long-Term Sustainability Plan, operations for the Sustainability Committee, disseminating sustainability information inside and outside the company, and planning, implementing and promoting measures to improve the corporate culture and organizational climate
Environmental Management Group
Planning and promotion of company-wide environmental measures, general planning for environmental strategies, and operation and management of the ISO 14001 environmental management system
Methods for Identifying Priority Issues
Through analysis of the risks and opportunities facing management and business, and through evaluation of priorities from the perspective of stakeholders, we identified issues (materiality) that should be given priority. We will continue to regularly review and revise these Priority Issues to meet changes in the environment.

Targets
In our Medium- to Long-Term Sustainability Plan that begins in FY 2022 and ends in 2030, we set action targets centered on the Seven Priority Issues.
In addition, we have changed some materiality themes and materiality names to broaden the scope of our efforts from FY 2025. We have also revised target values and expanded the scope of some targets to include the consolidated Group, including overseas subsidiaries.
See the Data Book for sustainability targets and achievements in the previous Business Plan for the Next Medium Term.
| Priority Issues | KPI | FY 2024 Performance |
FY 2024 Intermediate Target |
FY 2030 Target |
|
|---|---|---|---|---|---|
| Food and Well-being | Contribution to Well-being | Net sales of products with consideration for health issues (compared with FY 2021) ※1 | 1.2-fold | 1.2-fold | 1.7-fold |
| Participants in health promotion and nutrition education activities (FY 2021 to FY 2030) |
FY2024: 151,000 Cumulative total: 442,000 |
Total 350,000 | Total 1,000,000 | ||
| Promote research and development that safely and reliably leads to the creation of high-quality products that contribute to the health and nutrition of consumers | *KPI revised in FY 2025 | ||||
| Improve our image as a company that contribute to health (Corporate brand image survey ※2) | 20.4% | - | 25% | ||
| Improve our image as a supplier of products that provide tastiness and delightfulness (Corporate brand image survey ※2) |
*New KPI established in 2025 | 30% | |||
| Food safety and reliability | Acquisition of FSSC22000 and other GFSI certification standards at all Group manufacturing sites※3 | 100% | Maintenance and enhancement of certification at all domestic manufacturing sites | 100% | |
| Number of serious quality incidents* *Definition of serious incidents: Cases involving recalls due to legal violations, labeling errors, or voluntary recalls due to poor quality |
*KPI revised in FY 2025 | 0 | |||
| Resources and the Environment | Mitigation of and adaptation to climate change | Scope 1 + 2 CO₂ emissions reduction rate (compared to FY 2013) |
29.1% | 23% or higher | 50% or higher |
| Scope 3 GHG emissions reduction rate (compared to FY 2020) |
10.7% | 3% or higher | 10% or higher | ||
| Percentage of sites formulating BCPs to address climate change* Percentage of sites performing BCP compliance (preparing BCPs, etc.) |
100% *Only manufacturing sites in Japan directly operated by Morinaga Milk Industry Co., Ltd. In the future, we will formulate business continuity plans (BCPs) for domestic and overseas consolidated subsidiaries focusing on climate change. |
- | 100% | ||
| Environmental consideration and resource recycling | ISO14001 certification maintenance rate at domestic manufacturing sites | 100% *certification ratio at domestic production sites |
Completion of certification acquisition at domestic manufacturing sites | 100% | |
| Petroleum-derived virgin plastic usage reduction rate (compared to FY 2013) |
24.9% | 10% or higher | 25% or higher | ||
| Industrial waste recycling rate (zero emissions) |
99.7% | 99% | Achievement of zero emissions | ||
| Water resource usage reduction rate | 17.7% | 11% or higher | 15% or higher | ||
| Rate of accommodation of environment-friendly design in major brands | 95% | - | 100% | ||
| Sustainable raw material procurement | Rate of transition to RSPO mass balance certification | 80.6% | 80% |
100% |
|
| Usage ratio of FSC-certified or other environmentally friendly paper | 99.9% *As of the end of March 2024, only the inner seal for “Greek Yogurt PARTHENO Plain, Using No Sugar 280g” has not yet been switched due to a temporary suspension of sales. The switch is scheduled to be completed within fiscal year 2025. |
100% | 100% | ||
| Expansion of support for raw material suppliers | Expansion of supplier support through Sedex membership | - | 100% deployment of supplier support tools | ||
| Increase the number of initiatives aimed at enhancing the value of dairy industry | *New KPI established in 2025 | 500 | |||
| People and Society | Respect for Human Rights and Enhancement of Well-being | Ongoing implementation of initiatives to raise respect for human rights* Compliance with human rights policy, conduct human rights due diligence(DD), and creation of grievance mechanism |
Ongoing implementation of human rights impact assessment (1 overseas supplier, 1 domestic supplier) Held dialogue with overseas experts |
Human rights due diligence execution and measures; construction of continuity system | Ongoing compliance |
| Ratio of Female Managers | 7.2% | 10% or higher |
20% or higher | ||
| Childcare leave usage ratio (men) | 91.5% | - | 100% | ||
| Strengthen health management initiatives aimed at achieving "White 500 certification" status | *New KPI established in 2025 | Morinaga Milk Industry: maintain certification as Health & Productivity Management Outstanding Organization Domestic consolidated subsidiaries: promote certification of Health & Productivity Management Outstanding Organization |
|||
| Number of major work-related accidents | 0 | 0 (continued) | 0 (continued) | ||
| Employee engagement ratings | B | BBB (by FY 2028) |
A | ||
| Amount of investment in human resource development | ¥43,000/person/year | - | ¥50,000/person/year | ||
| Coexistence with local communities | Number of participants in community activities at each business site (FY 2021 to FY 2030) |
FY2024: 46,000 Cumulative total: 65,000 |
Total: 37,000 | Total: 100,000 | |
| Ratio of Group business sites carrying out community activities | 98.8% in Japan | 100% in Japan | 100% in Group | ||
「-」:KPI metrics revised or newly established in fiscal year 2025 will begin accumulation starting in fiscal year 2025.
※1 Sales of products included in each domain of the Health Improvement Map (Topics: Product design with consideration for health issues)
※2 Morinaga Milk Industry's own consumer survey.
※3 However, manufacturing sites that receive entrustment from our clients, and apply special quality control systems designated by such clients are exempted from the application.

